← All work
Product design + front-end build
Trade Matrix
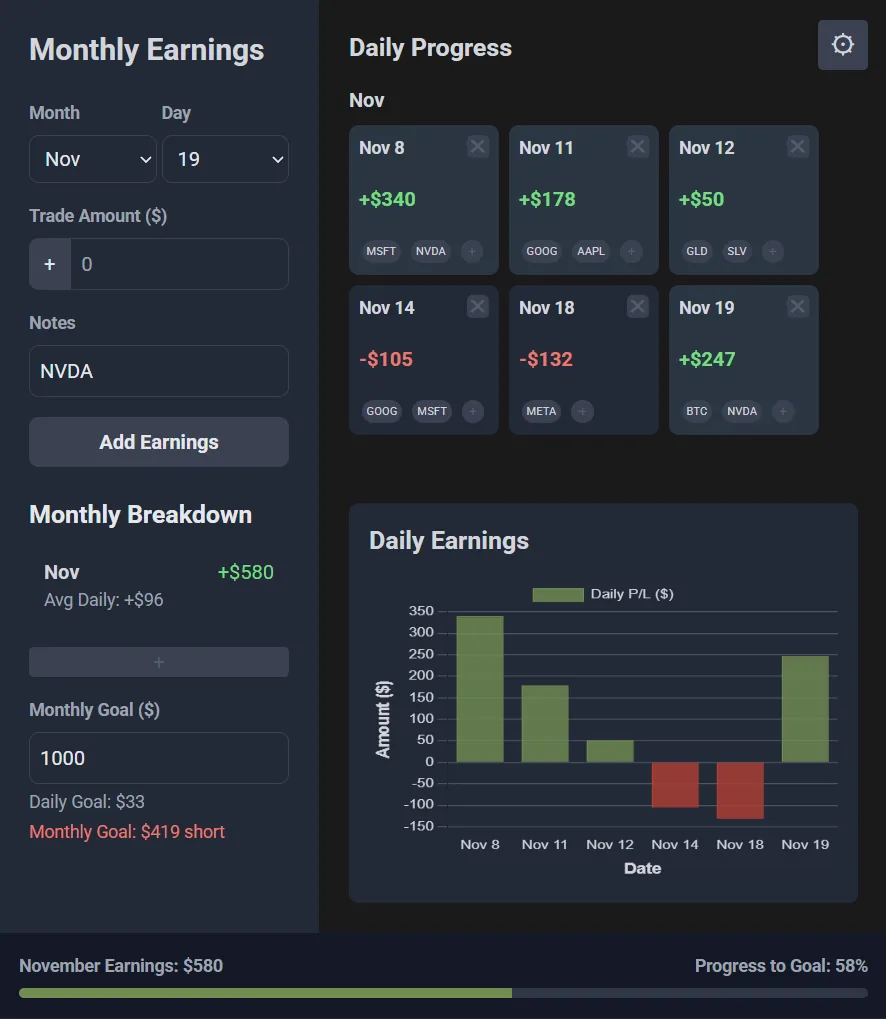
A responsive dashboard I designed and coded to track profit and loss across brokerages that don't talk to each other.
The problem
Active traders often split money across Robinhood, Webull, E-Trade and others. None of them combine results, so the real question — am I up this month? — takes a spreadsheet to answer.
Design decisions
- Fast manual entry: month, day, amount, ticker notes, done.
- Daily cards merge automatically — a second entry on the same day updates the total instead of cluttering the board.
- Averages, monthly totals and goal progress calculate live; a chart and a goal bar give the answer at a glance.
- Consistent card patterns and green/red coding keep cognitive load low on desktop and mobile.
- Month-end logic archives the data and starts a fresh cycle.